 IC Markets
 3:09
 2:39
 2:10
 2:18
 3:43
 8:42




















Buy the $4,000 dip
- Entry
- $4,000–$4,010
- Stop
- $3,965
- TP 1
- $4,045
- TP 2
- $4,100
Risk : reward1:1.0–2.4
Possible gain$40–$95

Market radar Checking the sessions…
Browser alerts
Your pairs and rate decisions, max 2 a day
FX Recap videos115 free videos
SubscribeDaily analysis
All technical analysis →Currency forecasts
Market data
Broker reviews
 IC Markets
 XM
 Exness
 FP Markets
 AvaTrade
 RoboForex
 LiteFinance
 IUX Markets
 FXTM
 Tickmill
 Vantage Markets
 Fusion Markets
 Elev8
 Pepperstone
Most compared
XM vs ExnessExness vs IC MarketsXM vs IC MarketsIC Markets vs FP MarketsRoboForex vs IC MarketsExness vs AvaTradePopular matchups
XM vs AvaTradeExness vs RoboForexAvaTrade vs FP MarketsIC Markets vs LiteFinanceXM vs RoboForex Exness vs IUX
More head-to-heads
Exness vs FP MarketsRoboForex vs FP MarketsXM vs FP MarketsAvaTrade vs IC MarketsRoboForex vs LiteFinanceAvaTrade vs RoboForexAsia
Africa
 Forex in South AfricaBest SA brokersKenya CMA brokersM-Pesa brokersForex legal in Nigeria?Forex tax in KenyaMarket hours in Nigeria
United Kingdom
Forex basics
Analysis & strategy
Topic guides
Prop trading
Trade calculators
All trade calculators →Risk & planning
All planning tools →Market data
Find & practise
All broker tools →Company
 About FX RecapOur videosOur methodologyMission & valuesAwardsForex data & researchPress roomAdvertise with usCareers
Trust & safety
Daily spot $4,018.30▲ +$111.10 · +2.84% vs previous
Neutral to bullish above $4,000
Next: US jobs report (October) · Fri 6 Nov
Live quote by TradingView. Chart, levels and stats use daily reference prices (ECB rates of 3 Nov, gold 06:46 UTC). Educational content, not financial advice.
 WriterAbir KhanWriterWrites the guides · checks every figure against primary sources View profileAbout Abir →

 Market analysisTanbir Habib RiyadForex & Crypto AnalystForex and crypto analyst · technical and fundamental analysis View profileAbout Tanbir →

 Fact-checking & riskJannatul FerdaushFact-Checker & Risk AnalystFact-checks every figure · risk analysis · Applied Statistics, University of Dhaka View profileAbout Jannatul →

 Trading reviewJowel RanaForex TraderForex trader · reviews guides from a trader's view View profileAbout Jowel →

 Final approvalRanjan N. MondolForex TraderForex trader · signs off every guide View profileAbout Ranjan →

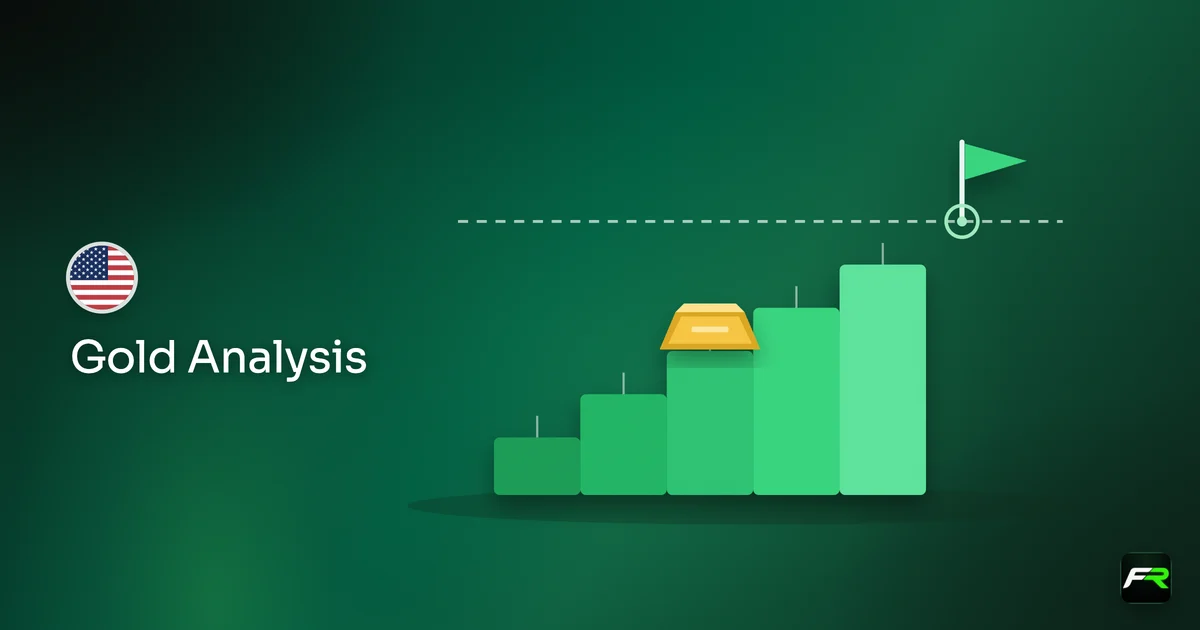
Spot gold was $4,018.30 an ounce at 06:46 UTC on Wednesday 4 November, according to gold-api.com, back above $4,000. Our previous reading, at 04:22 UTC on Monday 2 November, was $3,907.20, so the metal is $111.10 higher, and $141.90 above Friday's close of $3,876.40, the lowest reading in our log. US midterm results came in overnight. The highest reading in our log is still $4,045.20 from 29 October. Our official spot log only began on 25 October, so this page does not yet show moving averages or an RSI.
1Spot was $4,018.30 at 06:46 UTC, back above $4,000.
2Up $141.90 from Friday's close, the low of our log.
3$4,045 is the cap to clear.
Watch this on video
Reading a gold chart: part 5 of our gold trading series
A two-minute routine for any gold chart: the trend, support and resistance zones, round numbers, three timeframes and breakout and retest.
Both widgets update in real time, so they may differ from the levels written at ECB rates of 3 Nov, gold 06:46 UTC.
Distance is measured from the price at ECB rates of 3 Nov, gold 06:46 UTC.
Three setups for the days ahead: buy a dip to $4,000 to $4,010 with a stop below $3,965, buy a close above $4,050, or sell a close back below $3,990 if the rebound fails. Friday's US jobs report and the official Treasury yields after the vote are the main tests.
Gold has moved more than $100 between two of our readings twice in the past week, so stops need room. Use the gold lot size calculator to keep each loss to 1% to 2% of your account, and check the live chart before entering because these levels are not intraday highs or lows.
| Market Bias | Entry Zone | Stop Loss | Take Profit 1 | Take Profit 2 | Risk Reward | Possible Gain ($ per ounce) |
| Bullish | $4,000–$4,010 | $3,965 | $4,045 | $4,100 | 1:1.0–2.4 | $40–$95 |
| Bullish | Above $4,050 (close) | $4,010 | $4,100 | $4,150 | 1:1.3–2.5 | $50–$100 |
| Bearish | Below $3,990 (close) | $4,030 | $3,910 | $3,880 | 1:2.0–2.8 | $80–$110 |
If the dollar stays soft and Treasury yields ease after the vote, gold could hold above $4,000 and close above $4,050, the top of last week's band, opening $4,100 to $4,150.
A strong US jobs report or a bounce in yields could undo the rebound. A close below $3,990 would point back to $3,910 and Friday's $3,876 low.
Gold held above $4,000 from 26 to 29 October but could not clear $4,050, with readings of $4,043.50 and $4,045.20. It then fell hard: $3,994.90 early on 30 October and $3,876.40 at Friday's close, a drop of $168.80 from the high in two sessions, covered in our gold story.
The rebound has been just as quick. Monday's reading was $3,907.20, and by 06:46 UTC on Wednesday spot was $4,018.30, after US midterm results came in overnight. Gold is back inside last week's $4,000 to $4,050 band, with $4,045 the nearest cap. Our gold history starts on 25 October, so moving averages and an RSI will appear as the log grows; the levels below are our own readings plus round numbers. Our support and resistance guide explains why round numbers attract orders.
Over the last seven readings spot gold rose from $4,013.60 (26 October) to $4,018.30, a net gain of $4.70, but the path was anything but flat. Readings rose to $4,045.20 by 29 October, then fell $50.30 and $118.50 to Friday's close of $3,876.40, the largest move in our log. Monday's reading was $30.80 higher, and Wednesday's $111.10 higher again.
| Date | Reference rate | Change |
| Tue 27 Oct | $4,008.3 | −$5.3 (−0.13%) |
| Wed 28 Oct | $4,043.5 | +$35.2 (+0.88%) |
| Thu 29 Oct | $4,045.2 | +$1.7 (+0.04%) |
| Fri 30 Oct | $3,994.9 | −$50.3 (−1.24%) |
| Sat 31 Oct | $3,876.4 | −$118.5 (−2.97%) |
| Mon 2 Nov | $3,907.2 | +$30.8 (+0.79%) |
| Wed 4 Nov | $4,018.3 | +$111.1 (+2.84%) |
| 7-day range | $3,876.4 to $4,045.2 | +$4.7 (+0.12%) |
Tuesday's main scheduled event was the Reserve Bank of Australia, which raised its cash rate by a quarter point to 4.85% in a 6-3 vote and lifted its inflation forecasts. On the US Treasury's par curve the 2-year yield closed at 4.61% and the 10-year at 4.95%, both slightly higher on the day. US midterm election results came in overnight, after these rates were set; the Associated Press called the Senate for the Democrats, as reported by PBS NewsHour, and those results are unofficial until certified. Spot gold was $4,018.30 at 06:46 UTC on Wednesday (gold-api.com). The Bank of England decides on Thursday and the US jobs report follows on Friday. Currency prices on this page are ECB reference rates from Tuesday 3 November; the live chart shows where the market trades now. For gold, the dollar and real yields after the vote matter most; our gold and midterms story has the official yields and the levels to watch.
Energy prices are behind much of this year's inflation news, and US politics is now a second source of uncertainty. A change in control of Congress can alter expectations for spending and borrowing, which move yields and the dollar. That two-way risk keeps gold's daily ranges wide, so keep stops in place.
Gold is back above $4,000 after one of its sharpest two-day swings in our log. The bias is neutral to bullish above $4,000: buy dips to that line with a stop under $3,965, add only on a close above $4,050, and turn bearish on a close below $3,990.
A $169 drop and a $142 rebound in a week tells me gold is trading headlines. I like the $4,000 line as support, but $4,045 has turned buyers back before.
“I would buy $4,000 to $4,010 with a stop below $3,965, aiming for $4,045 and then $4,100. A close under $3,990 would make me step aside.”
Tanbir Habib Riyad, Forex & Crypto Analyst, FX Recap
For traders working through today’s setup, these guides cover the concepts used in this Gold Technical Analysis:
Follow FXRecap on YouTube for quick, chart-based analysis of gold, forex majors, indices, and major market moves: https://www.youtube.com/@fxrecap
This analysis is for educational purposes only and does not constitute personalized financial advice. Trading involves risk, and past chart behavior does not guarantee future results.
Source for the Fed’s policy stance: Federal Reserve — Monetary Policy involves risk of loss.
Every market below has its own page just like this one, with a live chart, a forecast range, and buy/sell signals. Pick a pair to see where it’s heading, or open today’s analysis for ready-made trade setups.
The team behind this guide
Researched, checked and approved by five forex specialists
Every guide is written, fact-checked and edited before it goes live, and updated when the facts change. Spotted an error? Tell us.
 Technical AnalysisEUR/USD Analysis Today: Reference Rate at 1.1179 After a Two-Day Bounce Stalls Under 1.1220EUR/USD's ECB reference rate was 1.1179 on Tuesday, 37 pips down after a two-day bounce from the 1.1130 low. Neutral to bearish below 1.1195. Levels, plans and a 7-day recap.Abir Khan4 November 2026
 Technical AnalysisGBP/USD Analysis Today: Pound at 1.3411, Above Its 50 and 100-Day Averages Before the BoEGBP/USD worked out at 1.3411 on Tuesday's ECB reference rates, near Monday's 20-day high of 1.3419 and above the 50 and 100-day averages. Bullish above 1.3375. Levels and a recap.Abir Khan4 November 2026
 Technical AnalysisUSD/JPY Analysis Today: Pair at 158.29, Through the 19 October High and Just Under 158.60USD/JPY worked out at 158.29 on Tuesday's ECB reference rates, up 39 pips and above its 20 and 50-day averages, under the 158.60 high. Neutral to bullish above 157.95.Abir Khan4 November 2026