IC Markets

 3:09
 2:39
 2:10
 2:18
 3:43
 8:42





































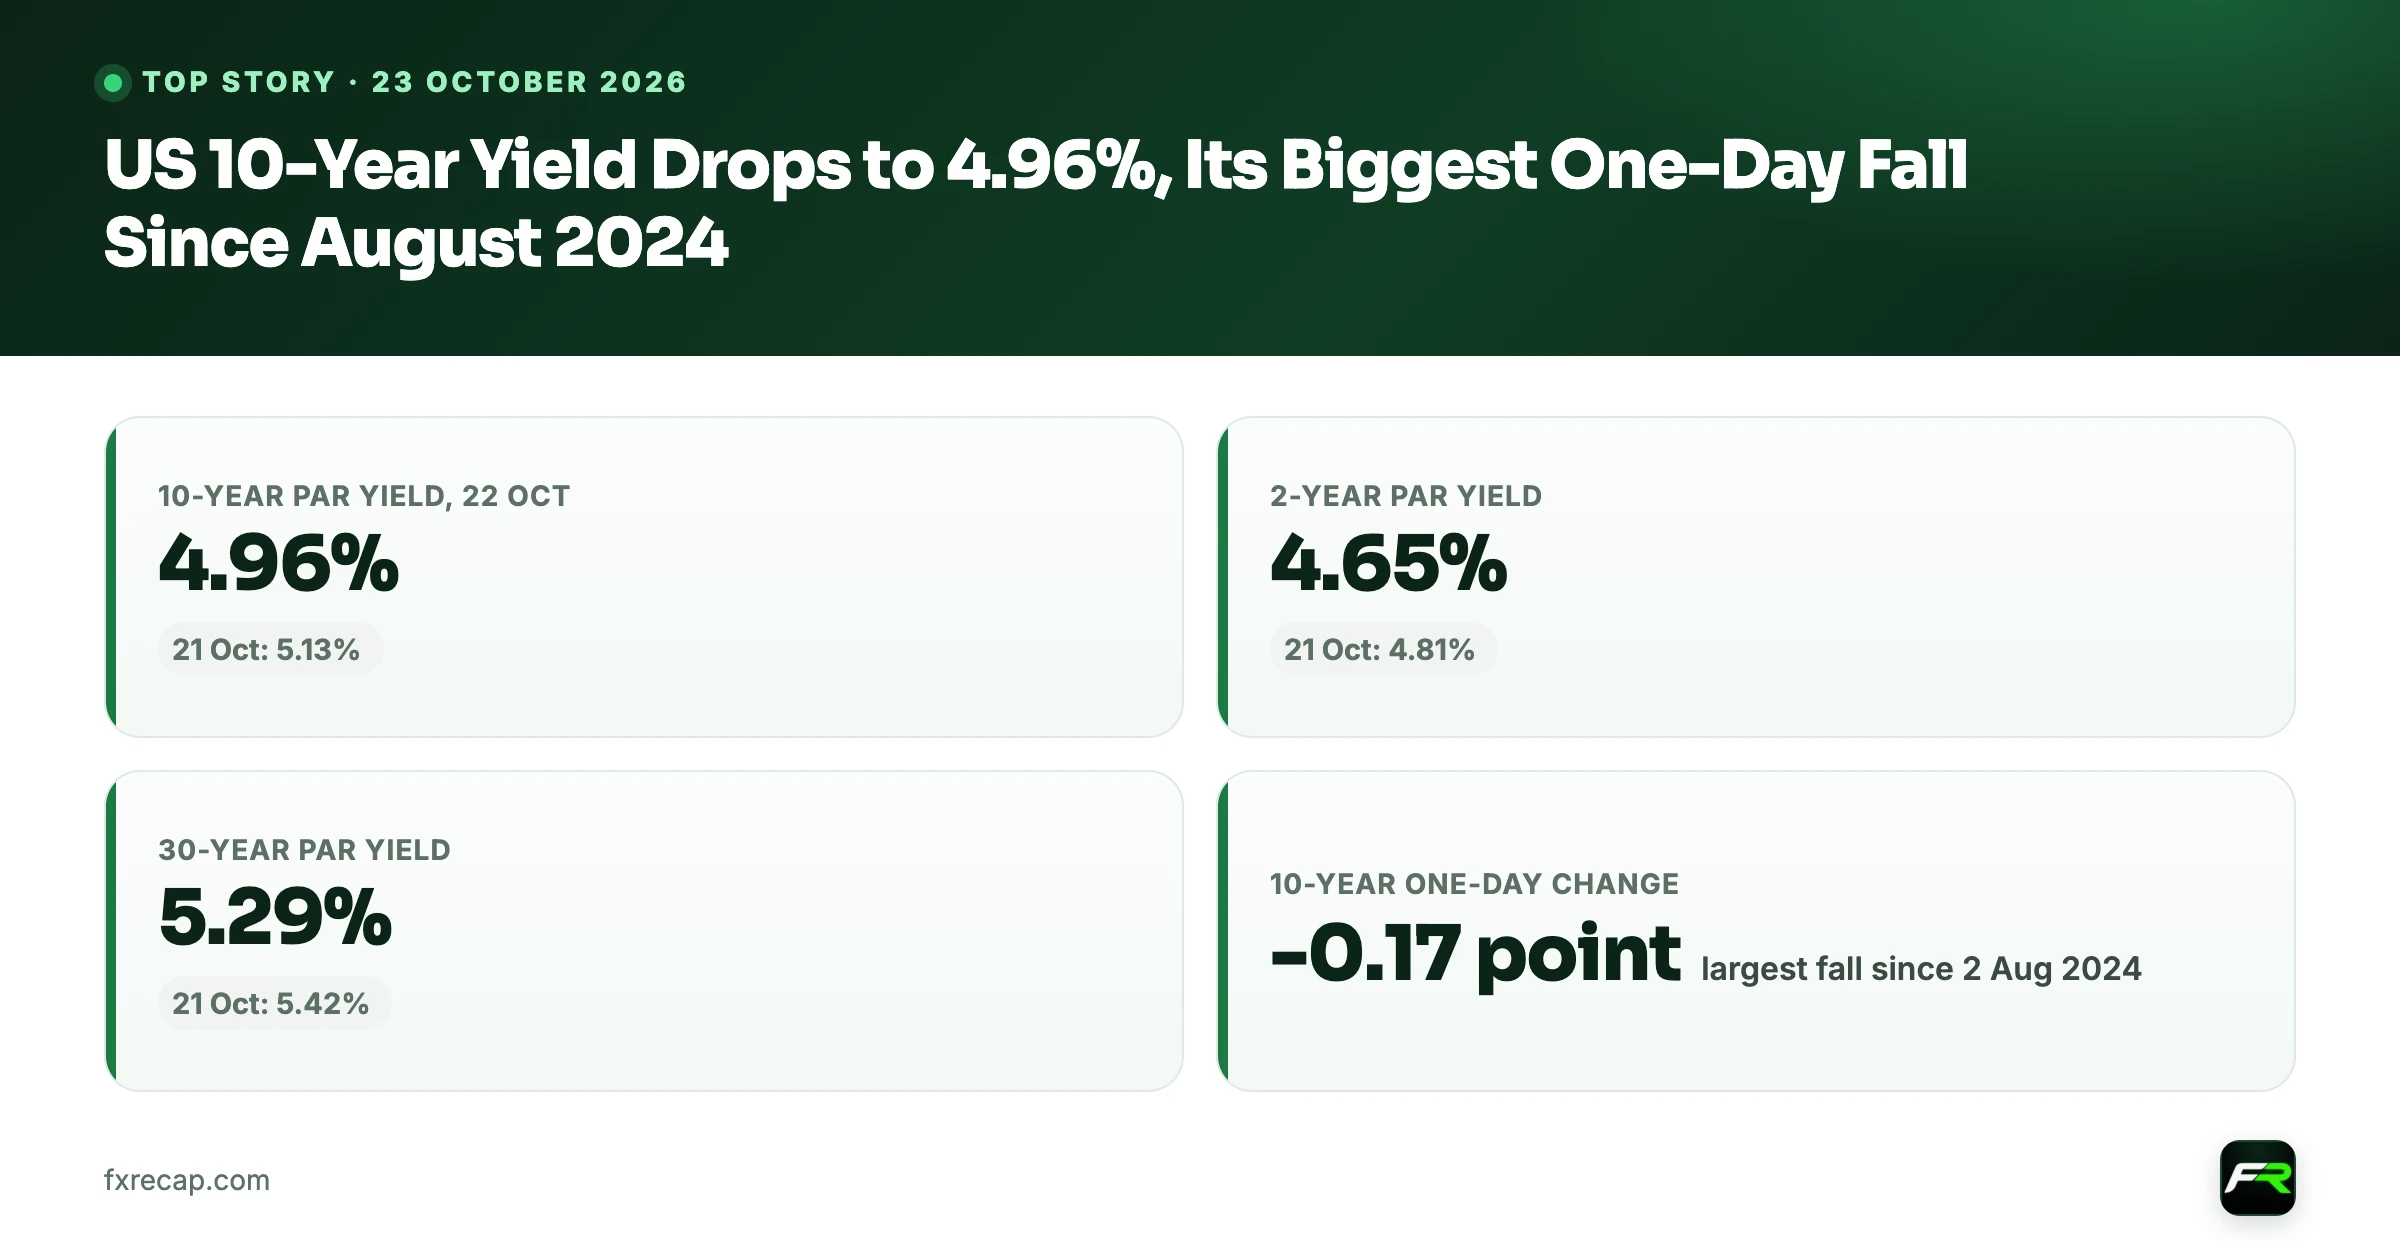
US 10-Year Yield Drops to 4.96%, Its Biggest One-Day Fall Since August 2024
A rush into bonds took 0.17 point off the 10-year yield in a day and lifted the yen, while gold slid and Brent climbed, five days before the Fed decides.
 WriterAbir KhanWriterWrites the guides · checks every figure against primary sources View profileAbout Abir →

 Market analysisTanbir Habib RiyadForex & Crypto AnalystForex and crypto analyst · technical and fundamental analysis View profileAbout Tanbir →

 Fact-checking & riskJannatul FerdaushFact-Checker & Risk AnalystFact-checks every figure · risk analysis · Applied Statistics, University of Dhaka View profileAbout Jannatul →

 Trading reviewJowel RanaForex TraderForex trader · reviews guides from a trader's view View profileAbout Jowel →

 Final approvalRanjan N. MondolForex TraderForex trader · signs off every guide View profileAbout Ranjan →

US government bond yields fell sharply on Thursday 22 October. The 10-year Treasury yield closed at 4.96% on the Treasury's own par yield curve, down from 5.13% a day earlier. That 0.17-point drop is the largest one-day fall for the 10-year since 2 August 2024, and it leaves the benchmark at its lowest level since 22 September. Shorter maturities fell just as fast, with the 2-year yield down to 4.65% from 4.81%.
Currency markets felt it mostly through the yen. USD/JPY fell from about 158.14 at the start of Thursday's UTC session to 156.54 at its close, touching 156.39 on the way. EUR/USD moved far less and ended the day slightly lower at about 1.1225, so this was not a broad dollar sell-off. Gold futures lost about 2.5% to $4,038.5 an ounce, while Brent crude futures rose to $113.08 a barrel.
No fresh signal came from the Federal Reserve. Its officials are in the quiet period before the 27 and 28 October meeting, and the Board's website lists no speech since 14 October. The Globe and Mail reported that investors moved into bonds as technology shares sold off on renewed doubts about how long the boom in artificial-intelligence spending can last. Yahoo Finance reported a broad drop in tech stocks, led by Meta after its quarterly results.
| 10-year par yield, 22 Oct | 4.96% (21 Oct: 5.13%) |
|---|---|
| 2-year par yield | 4.65% (21 Oct: 4.81%) |
| 30-year par yield | 5.29% (21 Oct: 5.42%) |
| 10-year one-day change | -0.17 point, largest fall since 2 Aug 2024 |
| 10-year high this year | 5.31% on 5 October |
| USD/JPY, 22 Oct (UTC day) | 158.14 to 156.54 |
| Gold futures, 22 Oct | $4,142.6 to $4,038.5 |
| Fed funds target range | 3.75% to 4.00%, decision 28 October |
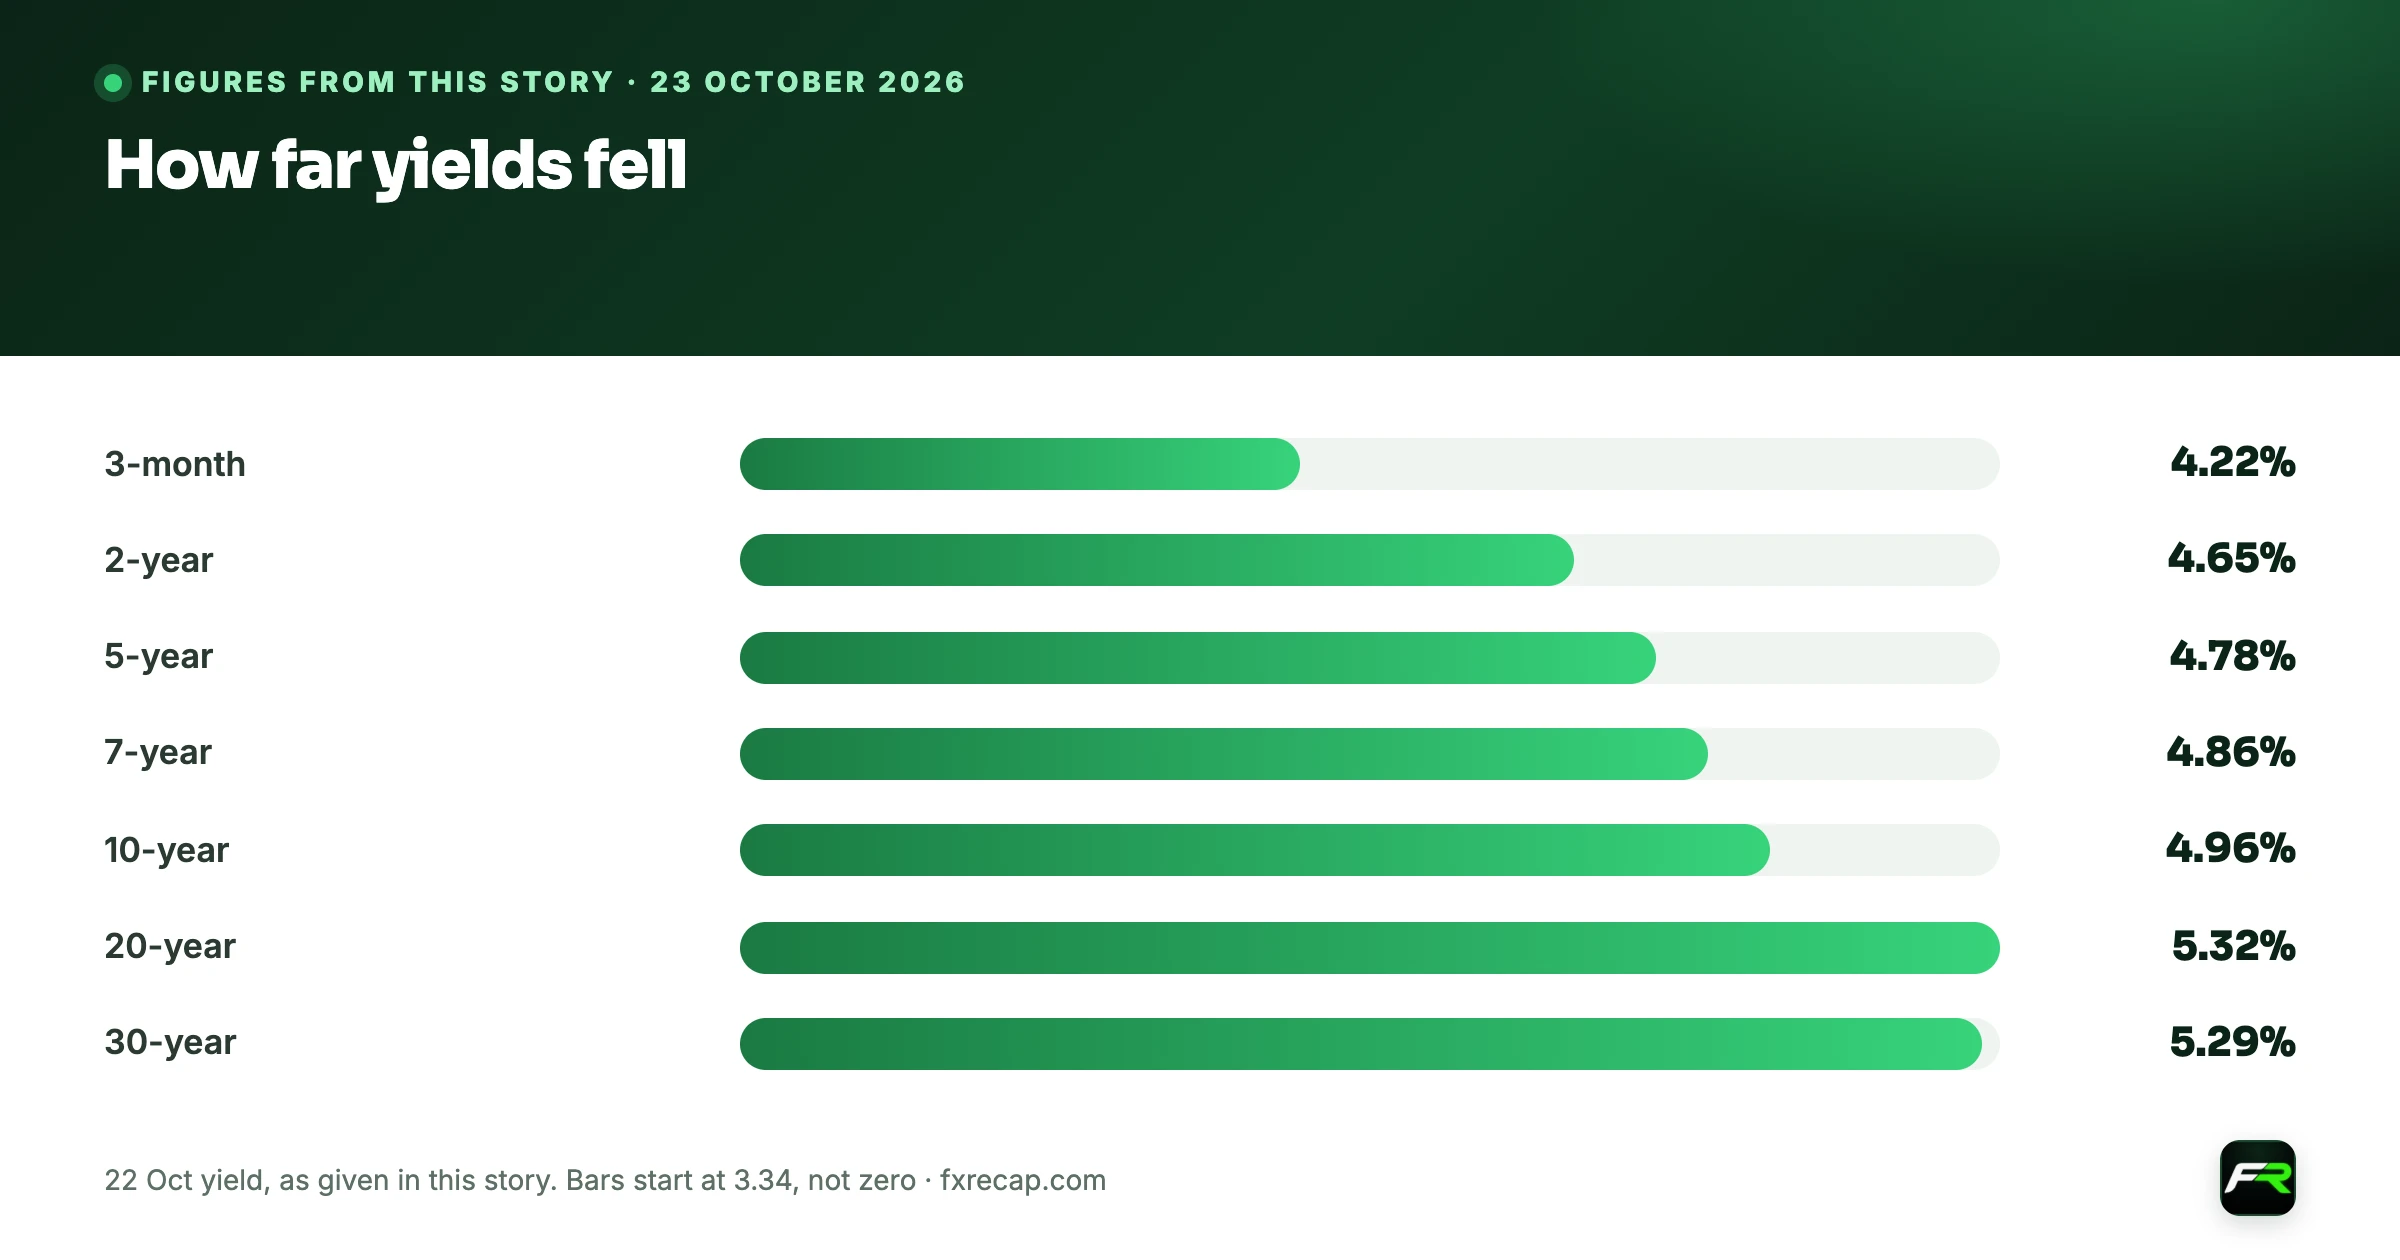
How far yields fell
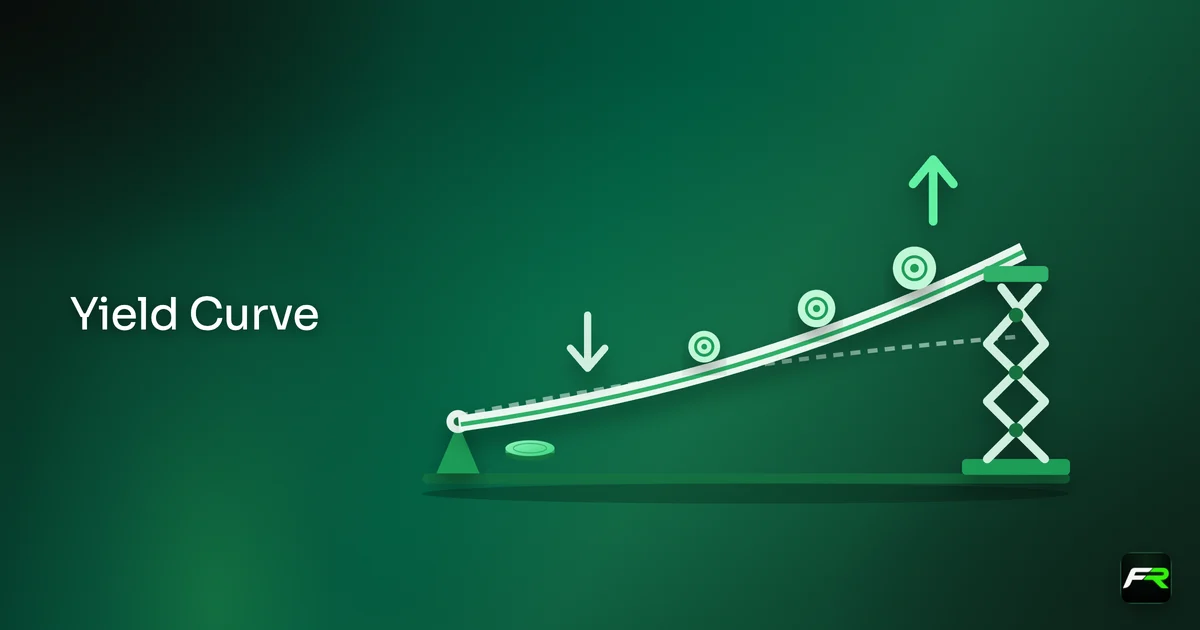
The fall ran along the whole curve but was biggest in the middle. The 5-year yield also dropped 0.17 point, to 4.78%, and the 7-year fell to 4.86% from 5.03%. At the long end, the 20-year yield slipped to 5.32% and the 30-year to 5.29%, smaller moves of 0.15 and 0.13 point. Bills barely changed: the 3-month rate eased to 4.22% from 4.25%, which shows that traders did not suddenly price an early rate cut.
A move this size is rare. Treasury's data show only a handful of bigger one-day drops in the 10-year since 2023, and they came on days of stress, such as 10 March 2023, when Silicon Valley Bank failed, and 2 August 2024, when a weak US jobs report was published. For the 2-year, Thursday's 0.16-point fall was the largest since 1 August 2025.
Most of October's climb has now been undone. The 10-year par yield peaked for the year at 5.31% on 5 October and was still 5.13% on Wednesday. One session took it back below 5% for the first time since 22 September, the last day it closed at 4.96%.
| Maturity | 22 Oct yield | 21 Oct yield | Change |
|---|---|---|---|
| 3-month | 4.22% | 4.25% | -0.03 |
| 2-year | 4.65% | 4.81% | -0.16 |
| 5-year | 4.78% | 4.95% | -0.17 |
| 7-year | 4.86% | 5.03% | -0.17 |
| 10-year | 4.96% | 5.13% | -0.17 |
| 20-year | 5.32% | 5.47% | -0.15 |
| 30-year | 5.29% | 5.42% | -0.13 |
Source: US Treasury, daily par yield curve rates. Changes are in percentage points.
Why the yen moved most
USD/JPY is the major pair most closely tied to US yields. The gap between US and Japanese interest rates is wide, and many investors fund dollar holdings by borrowing in yen. When US yields drop, that gap narrows and some of those positions are cut. Thursday fit the pattern: the pair slid steadily through the New York session, from about 157.26 at 14:00 UTC to 156.78 at 18:00 UTC, and kept falling into the Asian open.
Europe's currencies told a different story. EUR/USD fell to 1.1193 during the day before recovering to about 1.1225, and GBP/USD finished near 1.3404, little changed. The US dollar index ended at about 101.57 from 101.69. Traders cut dollar exposure against the yen far more than against the euro or the pound, which is typical of a day driven by falling yields and nervous stock markets rather than by a change in the US growth outlook.
On Friday morning in Asia the yen gave a little back. USD/JPY traded near 156.94 at 06:20 UTC, after Japan's September inflation data showed prices rising faster than in August. Our story on Japan's September CPI covers the Japanese side of the pair.
Gold fell and oil rose
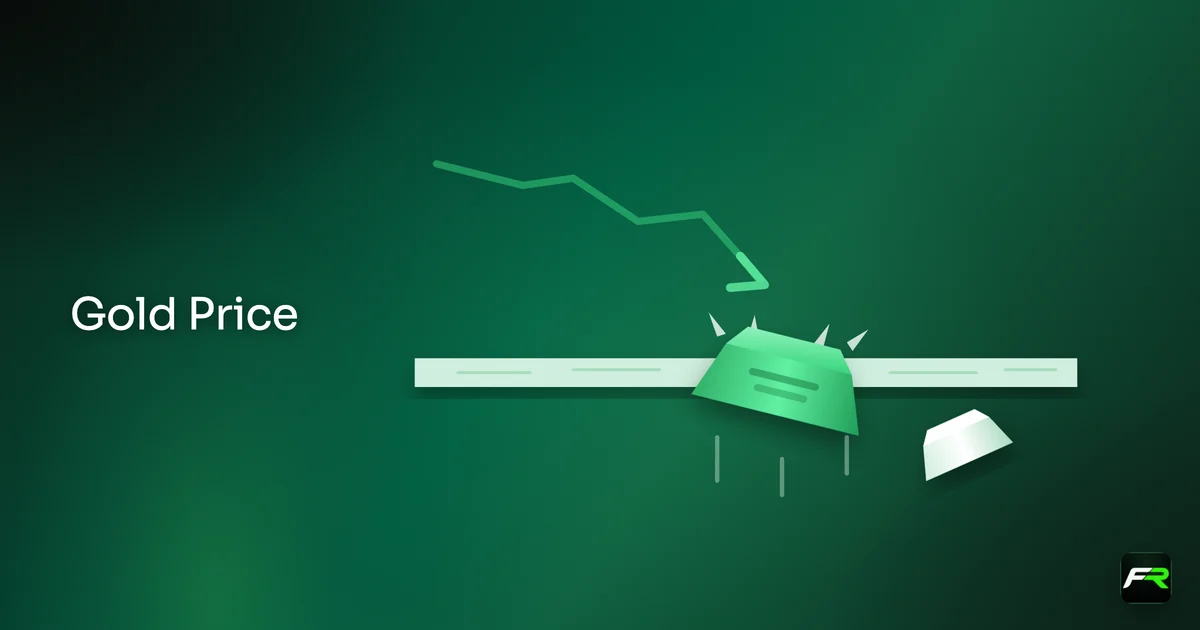
Lower yields usually help gold, since the metal pays no interest and becomes cheaper to hold when bond returns drop. Thursday broke that rule. Gold futures fell from $4,142.6 at the start of the UTC day to $4,038.5 at its close, with most of the loss coming after 13:00 UTC as US trading got going. Spot gold stood near $4,022 at 06:17 UTC on Friday, according to gold-api.com.
One possible reading is that some investors sold gold to raise cash or cover losses elsewhere, which often happens on sharp risk-off days. That is FX Recap's interpretation, not a fact from an official source. Traders who hold gold as a hedge against falling yields should note that the link can break for a day or two when stocks drop hard.
Oil went the other way. Brent crude futures rose from $110.06 to $113.08 a barrel on Thursday and were near $114.48 early on Friday, with WTI back above $100. Higher energy prices keep inflation fears alive, and that tension matters for the Fed. A rally in bonds on growth worries does not remove the inflation problem that pushed it to raise rates in September.
What it means before the Fed
The Federal Reserve raised its target range to 3.75% to 4.00% on 16 September and announces its next decision at 14:00 New York time on Wednesday 28 October, which is 18:00 UTC. US consumer prices rose 3.7% over the year to September, according to the Bureau of Labor Statistics, so inflation is still well above the Fed's 2% goal.
Thursday's rally does not mean markets expect a cut. Bill yields hardly moved, and a 2-year yield of 4.65% still sits above the top of the Fed's range. What the day does show is a bond market that has become more sensitive to signs of weaker growth and stress in equities. If that continues, the dollar's support from high yields could fade further, especially against the yen.
Japan's central bank meets on 29 and 30 October, two days after the Fed. Its policy rate is 1.25% after a rise on 18 September. Falling US yields and firmer Japanese inflation both narrow the rate gap between the two countries, a mix that yen buyers have been waiting for. Still, one day of lower yields is a long way from a trend, and the Fed's message next week can push them straight back up.
What traders can take from it
Big yield moves can reset currency trends quickly. These points help you use them without taking oversized risk.
- Watch the 2-year yield. It tracks Fed expectations most closely, and a further fall below 4.65% would suggest traders see less chance of another hike.
- Compare USD/JPY with EUR/USD. When the yen gains far more than the euro, falling yields and risk aversion are driving the dollar rather than US data.
- Do not assume gold rises with every bond rally. On Thursday it fell 2.5% as yields dropped, so check the metal's own price action before trading the link.
- Keep an eye on oil. Brent above $110 keeps inflation pressure in place and can push yields back up fast.
- Reduce size into 28 and 30 October. The Fed and the Bank of Japan decide within about 48 hours of each other, and either can reverse a one-day move.
Say you sell USD/JPY at 156.90 because you expect lower US yields to keep pulling it down, with a stop at 157.40, 50 pips above. At 156.90, one pip on a standard lot of 100,000 units is worth about $6.37, so the stop risks about $319 per lot. On a $10,000 account with a 1% limit of $100, the right size is about 31,000 units. Holding through the Fed on 28 October would need a wider stop and a smaller position.
For today's levels, see our USD/JPY analysis, gold analysis and EUR/USD analysis. Every central bank date is on the economic calendar, and you can size each trade with the position size calculator.
Bond yields, the yen and gold can move sharply on risk-off days and around central bank decisions. Leverage magnifies losses as well as gains, so trade only with money you can afford to lose.
Yields are from the US Treasury's daily par yield curve; the comparisons with earlier days are FX Recap's calculation from that series. The Fed range and decision date are from the Federal Reserve, US inflation from the Bureau of Labor Statistics, and the Bank of Japan's rate and meeting dates from the Bank of Japan. The Globe and Mail and Yahoo Finance reported the stock market moves. Currency, gold and oil levels are market data from hourly bars to about 06:20 UTC on 23 October and differ slightly between providers. This is news, not investment advice.
Cite this guide
FX Recap, "US 10-Year Yield Drops to 4.96%, Its Biggest One-Day Fall Since August 2024", updated 23 October 2026, https://fxrecap.com/forex-news/top-stories/us-treasury-yields-biggest-drop-since-2024
Free to quote with a link. Journalists: data and comment in our press room.
Frequently asked
Why did US Treasury yields fall on 22 October 2026?
No official news explains the move, and Fed officials were in their quiet period before the 28 October meeting. The Globe and Mail reported that investors bought bonds as technology shares sold off on doubts about AI spending. The 10-year par yield fell to 4.96% from 5.13%.
How big was the drop in the 10-year Treasury yield?
The 10-year par yield fell 0.17 percentage point in one day, according to US Treasury data. That is the largest one-day fall since 2 August 2024. The 2-year yield fell 0.16 point to 4.65%, its largest drop since 1 August 2025.
Why did USD/JPY fall when US yields dropped?
Lower US yields narrow the interest rate gap between the US and Japan, which reduces the appeal of holding dollars funded in yen. USD/JPY fell from about 158.14 to 156.54 on 22 October, while EUR/USD barely moved.
When is the next Federal Reserve decision?
The Federal Reserve announces its next decision on 28 October 2026 at 14:00 New York time, which is 18:00 UTC. Its target range is 3.75% to 4.00% after a rise on 16 September 2026. The Bank of Japan decides on 30 October.
Sources: US Treasury: Daily Treasury par yield curve rates · Federal Reserve: FOMC meeting calendar · Federal Reserve: Speeches · Bank of Japan: Monetary Policy Meetings schedule
The team behind this guide
Researched, checked and approved by five forex specialists
Every guide is written, fact-checked and edited before it goes live, and updated when the facts change. Spotted an error? Tell us.